
JBoss tuning tip 1: Tune the garbage collector
One strength of the J2SE platform is that it shields the developer from the complexity of memory allocation. However, once garbage collection is the principal bottleneck, it is worth understanding some aspects of this hidden implementation
An object is considered garbage when it can no longer be reached from any pointer in the running program. The most straightforward garbage collection algorithms simply iterate over every reachable object. Any objects left over are then considered garbage. The time this approach takes is proportional to the number of live objects,
The complete address space reserved for object memory can be divided into the young and tenured generations.

The young generation consists of eden and two survivor spaces. Most objects are initially allocated in eden. One survivor space is empty at any time, and serves as the destination of any live objects in eden and the other survivor space during the next copying collection. Objects are copied between survivor spaces in this way until they are old enough to be tenured (copied to the tenured generation).
A third generation closely related to the tenured generation is the permanent generation which holds data needed by the virtual machine to describe objects that do not have an equivalence at the Java language level. For example objects describing classes and methods are stored in the permanent generation
Use the the command line option -verbose:gc causes information about the heap and garbage collection to be printed at each collection. For example, here is output from a large server application:
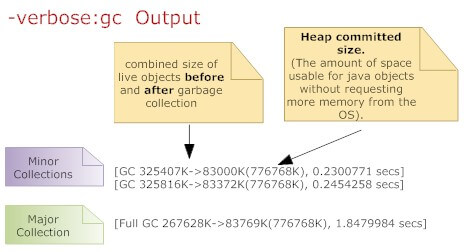 It's demonstrated that an application that spends 10% of its time in garbage collection can lose 75% of its throughput when scaled out to 32 processors
(http://java.sun.com/javase/technologies/hotspot/gc/gc_tuning_6.html)
JBoss tuning tip 2: Set -Xms and -Xmx to the same value
By default, the virtual machine grows or shrinks the heap at each collection to try to keep the proportion of free space to live objects at each collection within a specific range.
Setting -Xms and -Xmx to the same value. This increase predictability by removing the most important sizing decision from the virtual machine.
JBoss tuning tip 3: Use server VM
The server JVM is better suited to longer running applications. To enable it simply set the -server option on the command line.
JBoss tuning tip 4: Turn off distributed gc
The RMI system provides a reference counting distributed garbage collection algorithm. This system works by having the server keep track of which clients have requested access to remote objects running on the server. When a reference is made, the server marks the object as "dirty" and when a client drops the reference, it is marked as being "clean.". However this system is quite expensive and by default runs every minute.
Set it to run every 30 minute at least
-Dsun.rmi.dgc.client.gcInterval=1800000
-Dsun.rmi.dgc.server.gcInterval=1800000
JBoss tuning tip 5: Turn on parallel gc
If you have multiple proessors you can do your garbage collection with multiple threads. By default the parallel collector runs a collection thread per processor, that is if you have an 8 processor box then you'll garbage collect your data with 8 threads. In order to turn on the parallel collector use the flag -XX:+UseParallelGC. You can also specify how many threads you want to dedicate to garbage collection using the flag -XX:ParallelGCThreads=8.
JBoss tuning tip 6: Don't use Huge heaps, use a cluster
More JVMs/smaller heaps can outperform fewer JVMs/Larger Heaps. So instead of huge heaps, use additional server nodes. Set up a JBoss cluster and balance work between nodes.
JBoss tuning tip 7: Don't choose an heap larger then 70% of your OS memory
Choose a maximum heap size not more then 70% of the memory to avoid excessive page faults and thrashing.
JBoss tuning tip 8: Tune the Heap ratio
This is one of most important tuning factor: the heap ratio. The heap ratio specifies how the amount of the total heap will be partitioned between the young and the tenured space. What happens if you have lots of long lived data (cached data, collections ) ? maybe you're in this situation:
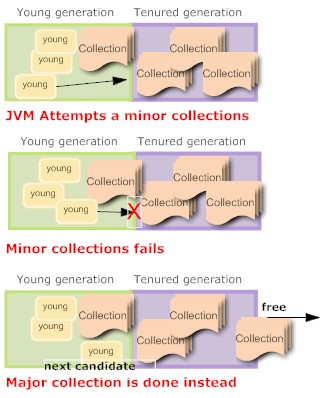
The problem here is that the long lived data overflows the tenured generation. When a collection is needed the tenured generation is basically full of live data. Much of the young generation is also filled with long lived data. The result was that a minor collection could not be done successfully (there wasn't enough room in the tenured generation for the anticipated promotions out of the young generation) so a major collection was done.
The major collection worked fine, but the results again was that the tenured generation was full of long lived data and there was long lived data in the young generation. There was also free space in the young generation for more allocations, but the next collection was again destined to be a major collection.
This will eventually bring your application to crawl !!!!!
By decreasing the space in the young generation and putting that space into the tenured generation (a value of NewRatio larger than the default value was chosen), there was enough room in the tenured generation to hold all the long lived data and also space to support minor collections. This particular application used lots of short lived objects so after the fix mostly minor collections were done.
NewRatio is a flag that specifies the amount of the total heap that will be partitioned into the young generation. It's the tenured-generation-size / young-generation-size. For example, setting -XX:NewRatio=3 means that the ratio between the young and tenured generation is 1:3
If you want a more precise control over the young generation : NewSize is the initial size of the young generation, MaxNewSize will specify the maximum size of the young generation
If you want a more precise control over the young generation : NewSize is the initial size of the young generation, MaxNewSize will specify the maximum size of the young generation
What is the recommeded heap ratios ? Set the tenured generation to be approximately two times the size of the young generation. With a 2GB of RAM the recommended sizes are 1200MB for the heap and 400MB for the young generation. This recommendation is only a starting point, you have to tune from there and to do that you have to gather and analyze the garbage collection statistics.
JBoss thread pool is defined into conf/jboss-service.xml
For most applications this defaults will just work well, however if you are running an application with issues lots of requests to jboss (such as EJB invocations) then monitor your thread pool. Open the Web Console and look for the MBean jboss.system:service=ThreadPool.
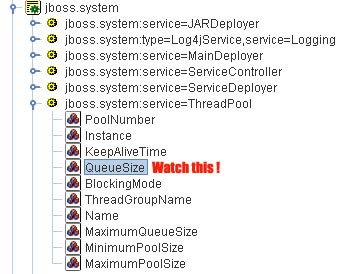
Start a monitor on the QueueSize parameter. Have you got a QueueSize which reaches MaximumPoolSize ? then probably you need to set a higher MaximumPoolSize pool size attribute
Watchout! Speak at first with your sysadmin and ensure that the CPU capacity support the increase in threads.
Watchout! if your threads make use of JDBC connections you'll probably need to increase also the JDBC connection pool accordingly. Also verify that your HTTP connector is enabled to handle that amount of requests
JBoss tuning tip: Check the Embedded web container
JBoss supports connectors for http, https, and ajp. The configuration file is server.xml and it's deployed in the root of JBoss web container (In JBoss 4.2.0 it's: "JBOSS_HOME\server\default\deploy\jboss-web.deployer")
The underlying HTTP connector of JBoss needs to be fine tuned for production settings. The important parameters are:
maxThreads - This indicates the maximum number of threads to be allocated for handling client HTTP requests. This figure corresponds to the concurrent users that are going to access the application. Depending on the machine configuration, there is a physical limit beyond which you will need to do clustering.
acceptCount - This is the number of request threads that are put in request queue when all available threads are used. When this exceeds, client machines get a request timeout response.
compression - If you set this attribute to “force”, the content will be compressed by JBoss and will be send to browser. Browser will extract it and display the page on screen. Enabling compression can substantially reduce bandwidth requirements of your application.
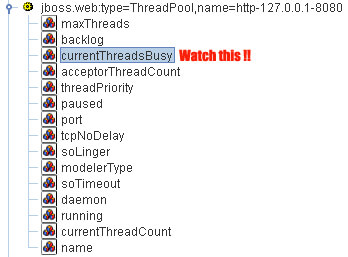
So how do you know if it's necessary to raise your maxThreads number ? again open the web console and look for the MBean jboss.web:name=http-127.0.0.1-8080,type=ThreadPool. The key attribute is currentThreadsBusy. If it's about 70-80% of the the maxThreads you should consider raising the number of maxThreads.
So how do you know if it's necessary to raise your maxThreads number ? again open the web console and look for the MBean jboss.web:name=http-127.0.0.1-8080,type=ThreadPool. The key attribute is currentThreadsBusy. If it's about 70-80% of the the maxThreads you should consider raising the number of maxThreads.
Watch out! if you increase the maxThreads count you need to raise your JBoss Thread pool accordingly.
JBoss tuning tip : Turn off JSP Compilation in production
JBoss application server regularly checks whether a JSP requires compilation to a servlet before executing a JSP. In a production server, JSP files won’t change and hence you can configure the settings for increased performance.
Open the web.xml in deploy/jboss-web.deployer/conf folder. Look for the jsp servlet in the file and modify the following XML fragment as given below:
<init-param>2.<param-name>development</param-name>3.<param-value>false</param-value>4.</init-param>5.<init-param>6.<param-name>checkInterval</param-name>7.<param-value>300</param-value>8.</init-param>Tip 9: Use Prepared Statement Cache:
In JBoss, by default,prepared statements are not cached. To improve performance one can configure a prepared statement cache of an arbitrary size. You can use in your -ds.xml file the <prepared-statement-cache-size> : this is the number of prepared statements per connection to be kept open and reused in subsequent requests.
Tip 10: Remove services you don't need
JBoss ships with lots of services, however you'll seldom need to use them all. The service is usually deployed as *-service.xml under the deploy directory. Sometimes it's also deployed as .sar/.rar archive.
In order to remove the service, remove the file in the "Server/deploy" column. If needed remove also the relative libs stated under "Server/lib"
Servizio
|
Server/deploy
|
Server/lib
|
Mail service
|
mail-service.xml
|
mail-plugin.jar, mail.jar,activation.jar
|
Cache invalidation service
|
cache-invalidation-service.xml
| |
J2EE client deployer service
|
client-deployer-service.xml
| |
Hibernate HAR support
|
hibernate-deployer-service.xml
|
jboss-hibernate.jar, hibernate2.jar, cglib-full-2.0.1.jar, odmg-3.0.jar
|
HSQL DB
|
hsqldb-ds.xml
|
hsqldb-plugin.jar, hsqldb.jar
|
Default JMS Service
|
jms folder
|
jbossmq.jar
|
HTTP Invoker (tunnels RMI through HTTP)
|
http-invoker.sar
| |
XA Datasources
|
jboss-xa-jdbc.rar
| |
JMX Console
|
jmx-console.war
| |
Web Console
|
management/web-console.war
| |
JSR-77
|
management/console-mgr.sar
| |
Monitoring mail alerts
|
monitoring-service.xml
|
jboss-monitoring.jar
|
Schedule Manager
|
schedule-manager-service.xml
|
scheduler-plugin.jar, scheduler-plugin-example.jar
|
Sample Schedule service
|
scheduler-service.xml
|
If you are removing a core JBoss service like JMS or EAR Deployer then you need to remove it also from the jboss-service.xml :
Simply comment the attribute relative to the unwanted service
Tip 11: Tell log4j to shut up !
Wel not really anyway Log4j uses a valuable amount of time/CPU so you had better remove unnecessary logs, for example :
Comment the following line in log4j.xml in order to remove logs on the Console:
remove also the relative appender:
<appender name="CONSOLE" class="org.apache.log4j.ConsoleAppender">
....
</appender>
....
</appender>
Consider raising the log level to the highest level possible in production. Here only error logs are written:
No comments:
Post a Comment